What is data visualization?
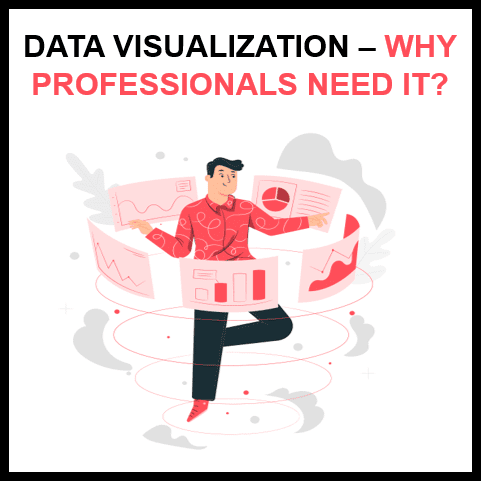
The graphical depiction of information and data is known as data visualization. Data visualization tools make it easy to examine and comprehend trends, outliers, and patterns in data by employing visual elements like charts, graphs, and maps.
Data visualization tools and technologies are critical in the Big Data environment for analyzing enormous volumes of data and making data-driven decisions. It’s difficult to imagine a professional field that doesn’t benefit from better data understanding.
Understanding data is beneficial to every profession, as well as fields such as government, finance, marketing, history, consumer products, service industries, education, and sports. While we always speak poetically, about data visualization, there are clear practical uses. Because visualization is so widespread, it’s also one of the most valuable professional talents to learn.
Why is data visualization important?
To fit a data-driven environment, skillsets are evolving. The ability to use data to make decisions and use graphics format to communicate stories about when data informs the who, what, when, where, and how it is becoming increasingly valuable. While traditional education often creates a distinction between creative storytelling and technical analysis, the new professional world encourages people who can bridge the gap: Data visualization stands amid analysis and visual storytelling.
Data visualization can help you in any business or job by distributing data in the most efficient way possible. Data visualization is an important phase in the business intelligence process because it takes the raw data, models it, and delivers it so that conclusions may be drawn. Machine learning algorithms are being developed by data scientists in advanced analytics to better assemble critical data into visualizations that are easier to grasp and analyze.
Data visualization, in particular, employs visual data to express information in a universal, quick and effective manner. This method can assist businesses in determining which regions need to be improved and which aspects need to be addressed.
Top 10 data visualizations examples of 2021 (500)
Data visualization can come in a variety of shapes and sizes.
We’ll look at the several types of data visualization that are regularly used by professionals, marketers, educators, researchers, and students in this part.
Example 1 Daily routine by Podio
This is one interactive piece. Has all the major components of how effective and attractive visuals look like.
Its important feature is that it combines all the data in one single page. Uses effective colors to showcase. Allows the user to get an idea of overall data by allowing them to interact easily.
Example 2 Package : The year in News by Echelon Insights
This one showcases how data visualization can show patterns and trends which are hiding beneath the surface.
This was all about what was the most talked about topic in America in 2014. Was created based on Twitter mentions.
Example 3 U.S age Pyramid by Pew Research Center
This one depicts how shifts and trends can be shown using animation. These data visualization techniques and animation are embedded into it and that’s what makes it spectacular.
Example 4 Infographics by Marion Luttenberger
Here using real-life examples based on infographics, this was created to take out an annual report for an organization that provides help to drug addicts in Austria and can still clearly point out the organization’s mission.
Example 5 Map of the Internet by Ruslan Enikeev
Appreciate this one as it showcases complex ideas through symbols.
Through using the metaphor of planets, Enikeev has created a map of the world.
Example 6 Universcale by Nikon
Here Nikon has used all the pieces of information together in a bigger context.
This one showcases the sense of all the objects of different sizes, can be big or small. It can be small as well.
Example 7 Package of 100 years of Rock by Concert Hotels
This one provides and condenses the century’s worth of info into visualization in a well-integrated way. Also provides samples of audio.
Example 8 Here is today by Whitevinyl
This data visualization tool shows some perspective of your lives and all the events planned for your current day by placing them in the bigger frame.
Example 9 Coffee by BizBrain
This makes the complexity easy to understand. This one provides a visual representation of a coffee beans journey from bean to cup.
It breaks the info into small pieces and then showcases.
Example 10 Are we alone by BBC
This one digests complex data into simpler ones. Also provides hypothetical solutions and possibilities. This one provides engagement for users.
Best data visualization tools
There are so many tools and scripts available for the visualization of data sets. Many are too basic but few of them have advanced features to experiment with. But some of them stand out. Make a list of a few good ones.
Tableau
Tableau offers a desktop program, server and hosted web editions, and a free public option, among other things. CSV files, Google Ads and Analytics data, and Salesforce data are just a few of the data import possibilities accessible
Multiple chart formats and mapping capabilities are available as output options. As a result, designers may develop color-coded maps that present regionally significant data in a style that is far more digestible than a table or chart.
Anyone looking for a powerful approach to generate data Visualization that can be utilized in several scenarios can use Tableau public edition, which is free to use
Infogram
It is a drag and drops data visualization brook that even non-designers can use to generate excellent data visualization for marketing reports, infographics, social media posts, maps, dashboards, and more.
The visualization can be saved in a variety of formats, including PNG, jpg, gif, or pdf. Interactive visualization is also conceivable, making them ideal for use in websites and apps. It also offers a WordPress plugin that simplifies the process of integrating visualization for WordPress users.
ChartBlocks
Data can be loaded from anywhere using ChartBlocks API, including live feeds, according to the company. They claim although that data can be imported from any source in a few clicks, but it’s likely to be more complicated than other apps that have automated modules or extensions for specific data sources.
The tool allows for great customization of the final presentation, and the chart construction wizard assists users in selecting the most appropriate data for their charts before importing them.
Datawrapper
It was established with the express purpose of adding charts and maps to bed reports. The interactive charts and maps developed can be embedded on the needed website. However, their data sources are limited, with copying and pasting data into the application being a major way.
Charts can be built with a single click once data has been input. The final visuals are similar to those found on the New York Times and Boston Globe websites.
Their free plan is ideal for embedding graphics on smaller sites with low traffic, but paid subscriptions start at $39 a month.
What are Data Visualization jobs?
There are various job profiles and jobs which come under Data visualization. It is required in the below designations: There are a variety of jobs in this field and all of them are good. Some are entry-level jobs and a few are advanced level. Based on timelines and goals, individuals can join them.
Data Visualization Specialist
Their salary ranges from $40,000 to $90,000. For this role, you need to have a Btech degree or any respective education in Statistics, Maths, Business, or finance-related fields.
For sure 2 years of relevant experience is required. This is an advanced role and requires a good amount of learning and experience for this one.
Data Visualization Analyst
In Data visualization analyst roles, similarly, you need to have a combination of education and experience. A bachelor’s degree or any other degree in disciplines like mathematics, statistics, or related field of study.
Also, two or more years of experience in data or reporting is expected. Requires some experience on MySQL, as it has analysis as a part of it. For analyzing data, individuals need to have hands-on practice on queries before going forward with visualization.
Their salary ranges from $49,000 to $95,000 annually.
Data Visualization Engineer
Their salary ranges between $51,000 to $110,000 annually.
Data visualization engineers should either have a bachelor’s degree in computer science or a respective degree in computer information systems, software engineering, or any related degree.
You are expected to have three or more years of relevant technical experience or a master’s degree with one or more years of technical experience.
Requires some experience in the creation of data pipelines for creating the flow of data from different enterprises to visualization tools. Hence, some data pipeline experience is required.
Data Visualization Developer
Similarly, data visualization jobs for developers require a bachelor’s or master’s degree in computer science.
Plus individuals are expected to have experience in front-end technologies such as HTML5, ES6, TypeScript, JavaScript, and CSS.
Their salary range is in the $50,000 to $120,000 annually. This is a developer cum visualization job role. Required basic level of coding for understanding data flow.
Data visualization courses
Some helpful courses have been listed below which can help in Data Visualization career path:
For learning data analysis, integration of data and visualization using Pivot Tables in Excel
Coverage:
Pivot Tables and their importance
Data analysis using Pivot Tables
Consolidation of data with Pivot Chart Wizards
Data aggregation/visualization without using Pivot Tables
Comprises of:
Access up to 1 year
Courses can be accessed anytime and anywhere
1-hour free video provided regarding to demand
Can be accessed on Mobile or Tablet.
This course is a free one. A fresher or a working professional, who wants to move in this career path and has no idea regarding what Data visualization looks like, can enroll in this one. It is a free course and provides the basic layout of Data visualization, so provides a clear understanding.
2. Free Course – Creating Advanced Charts and Graphs in Excel:
This course covers some amazing visualization tools using advanced charts and graphs in excel.
Key Coverage:
Excel Dynamic Charts in four steps
3-Dimensional Charts for Effective Presentation skills
Track Stock Price and do analysis using Dynamic Line Charts
Working on Dynamic Progress Circle Charts
The Waterfall Chart in Excel 2016 and its limitations
Sunburst Charts through Excel
Comprises of:
Access for 1 year
Can be accessed anytime and anywhere
1.5 hours vied provided if demanded
Can be accessed on Mobile and Tablet
This course is a free one. More suitable for people who already have some idea on data visualization and have worked a bit on graphs or charts etc. This provides further detailed visualization techniques using excel. People who are looking for some advanced visualization skills can go through this course. It would be really helpful for such individuals.
Scope
Data Visualization has a brilliant career path and newbies or working professionals should give it a try. It is here for the long run. As the world is going digital, Data visualization will always be required to collect, form that data and integrate it to display together. As visualization is a technique to display, it has become a primary requirement in the field of big data.
Every day social media creates millions of data. Sites like Twitter, Facebook create live streaming of data. Companies integrate these data and perform visualization on it to study data better. Through studying the visualization, they can make better business decisions and increase their sales and revenues overall.
Conclusion
Overall, Data visualization has a huge scope and is an excellent skill. It is here to stay. Individuals wanting to start their career in this stream can refer to the courses listed above. They are some brilliant courses and they can help you to speed up the learning process. Data visualization is the present and the future.


One thought on “The Importance of Data Visualization for Professionals”
[…] Data visualization: Use data visualization techniques to present financial data in a clear and concise manner. Visualizing data through […]